Determination of the activity of an antioxidant by the DPPH° assay
Analyzing the results
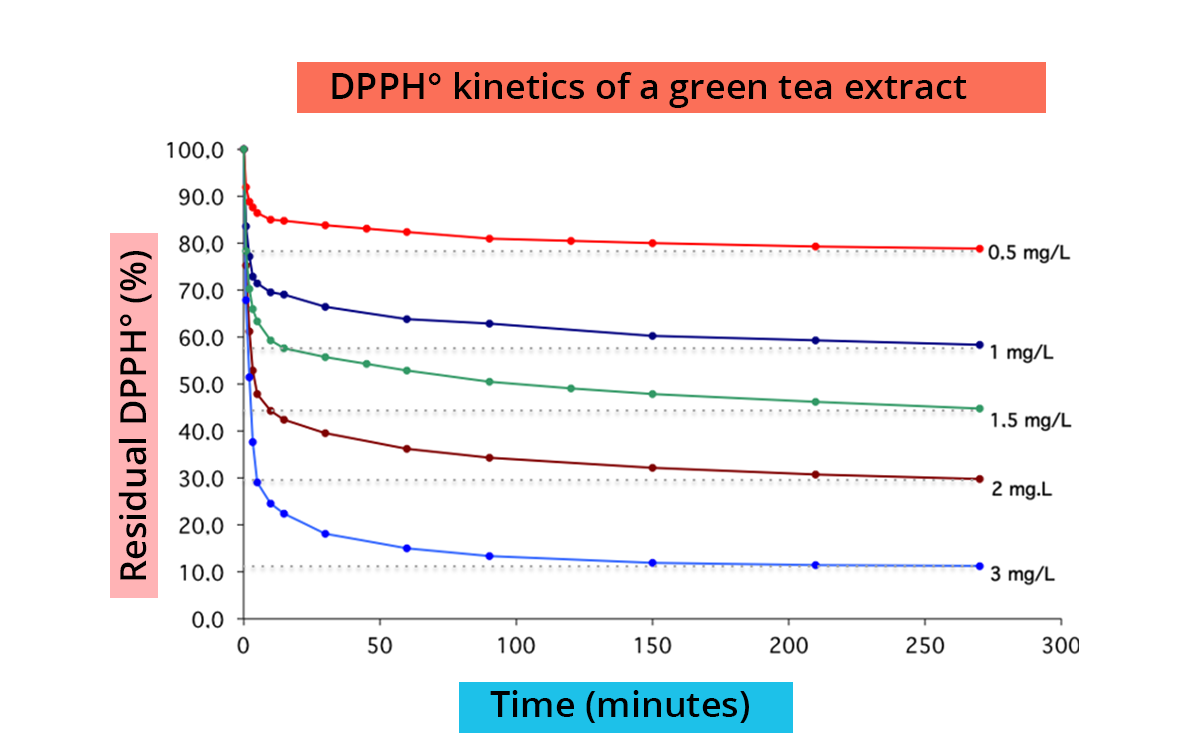
- For each antioxidant concentration, plot the curve representing the evolution of the residual DPPH° with time and extract the plateau value.
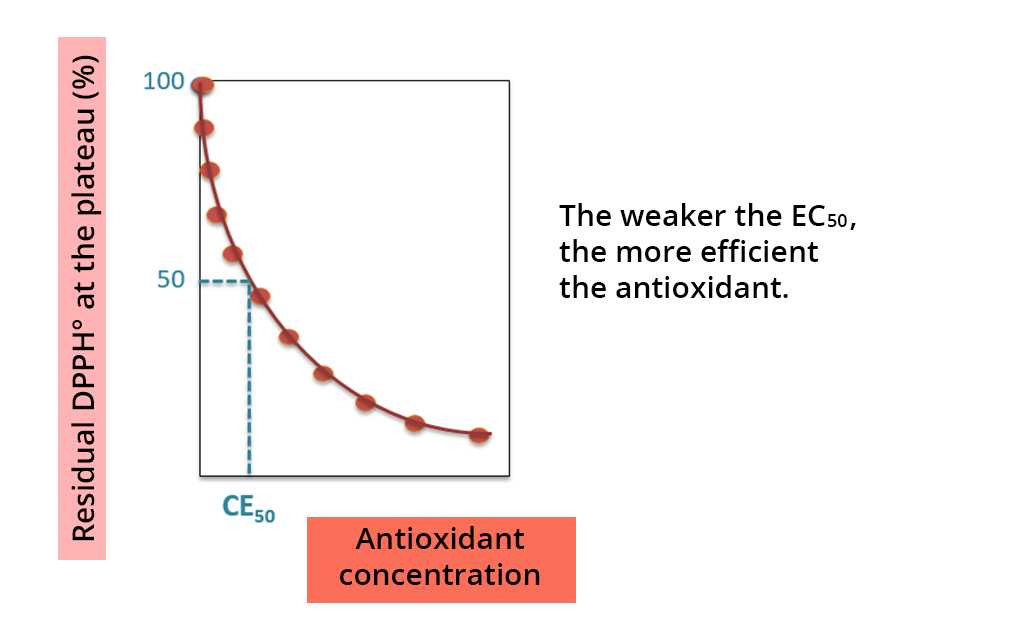
- Plot these values on a graph as a function of antioxidant concentration. This is the “dose-response curve”.
- Determine the value of the “effective concentration” EC50, which is the antioxidant concentration required to reduce 50% of the initial DPPH°. Depending on the type of antioxidant tested, EC50 is expressed in mol/L (pure antioxidant) or in g/L (plant extracts).