Basics of HPLC

Chromatographic parameters
Retention time (tr)
The retention time is the time taken by a compound to elute from the column and be detected. Conventionally, the retention time is determined at the apex of the chromatographic peak, which generally corresponds to half of the compound’s elution.
Retention factor (k)
The retention factor k (formerly called the capacity factor and noted as k’) tells us the capacity of the column to retain a compound in its parameterized elution conditions. To determine the retention factor, it is necessary to know the dead time* (tm) and retention time of the compound concerned (trx). The retention factor is determined with the following formula:
Where
tri : retention time of compound i
tm : dead time of the column
If
k ≤ 1: the elution is too fast
1 k ≥ 5: the elution is too slow
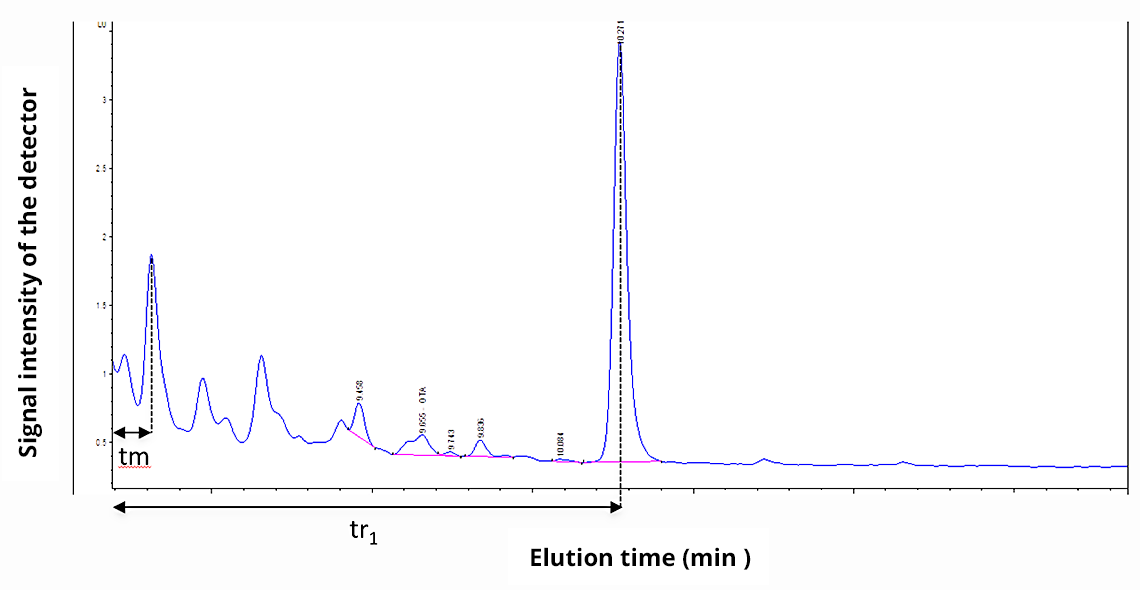
*Dead time (tm): the dead time is the minimum time required, after injection, for a compound to pass through the column and be analyzed. To determine the dead time of the column, a compound that is not retained by the column should be used that will elute with the mobile phase without interaction with the stationary phase.
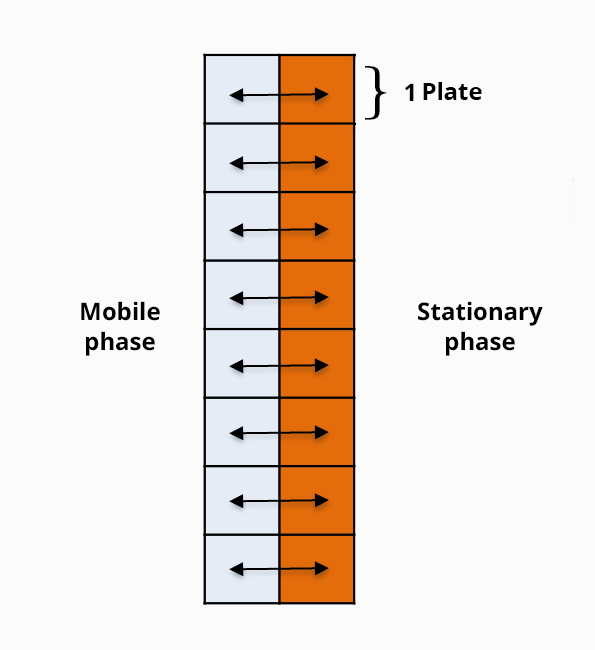
Column efficiency or plate number (N)
The column’s efficiency is determined generally by the number of theoretical plates the column will have in relation to the compound under consideration. The number of theoretical plates corresponds to the number of times a compound will be exchanged between the mobile phase and the stationary phase. Thus, the passing of a compound from the mobile phase to the stationary phase and then its return to the mobile phase represents one plate.
The number of theoretical plates can be determined with the following formula:
Where
tri: retention time of peak i
Ii: width at the base of peak i
The higher the number of plates, the more efficient the column is and the thinner the compound’s peak will be in the end.
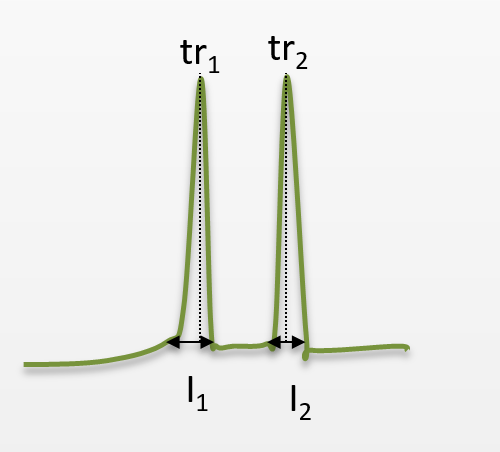
The resolution
Where:
tr1: retention time of peak 1 (or 2)
I1: width at the base of peak 1 (or 2)
The resolution is calculated only between two adjacent peaks – the higher the resolution, the better the separation of the peaks.
A resolution higher than 1 or even 1.5 is necessary to have a good peak integration and a correct calculation of the peak area.