
S/N in chromatography
In chromatography, the signal/noise ratio (S/N) can generally be indicated by the chromatogram treatment software. However, the values indicated can sometimes be unreliable, especially in the case of signals close to background noise. Therefore, it is important to be able to estimate it manually.
For a given analysis, a simple way is to proceed as follows:
1- Zoom in on the chromatogram in the vicinity of the retention peak of the analyzed compound
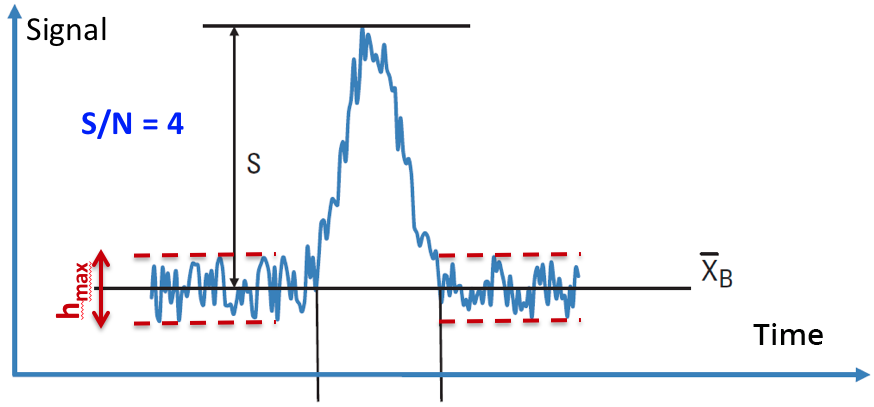
2- On either side of the compound peak over a sufficiently wide window (about 10 x the width at half-height of the peak): draw two straight lines, one through the maximum noise signal and the other through the minimum noise signal.
3- Evaluate the maximum height (hmax) of the variation of the background noise (taken as the “N” noise value)
4- Deduce an estimate of the S/N ratio value the peak of the compound obtained on the chromatogram under consideration.

- The LOD is the concentration corresponding to a signal (peak height) of 3 x hmax
- The LOQ is the concentration corresponding to a signal (peak height) of 10 x hmax