Exercise 2: Extraction then analysis of a mixture of 3 compounds.
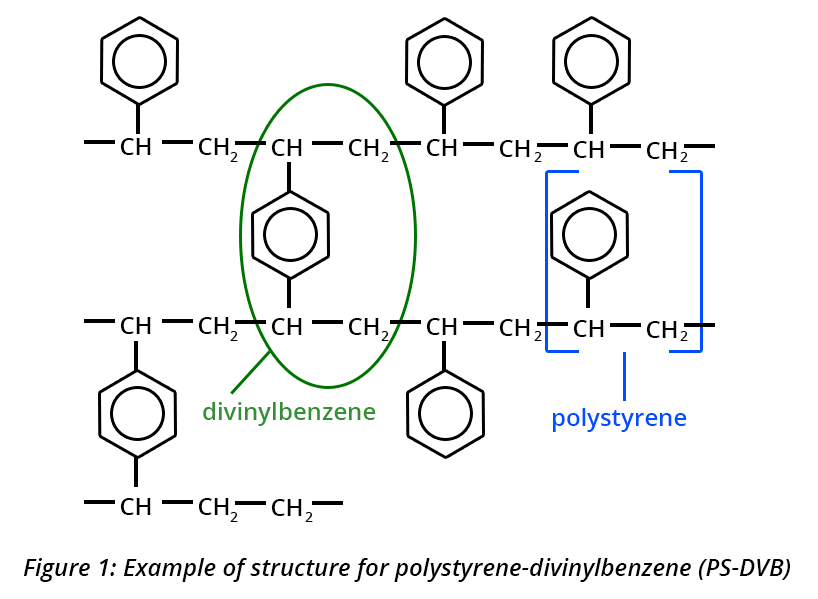
Three aromatic compounds (A, B and C) are assayed by reversed-phase partition chromatography, with a mobile phase based on water and methanol (MeOH). The detector is set to 245 nm. Prior to HPLC analysis, solid phase extraction (SPE) is required. The SPE phase tested is of the polystyrene-divinylbenzene type (Fig. 1).

Since the matrix of the future samples is aqueous and the main interferents are soluble in water, the first solid phase extraction test is carried out with an aqueous control solution of the compounds A, B and C in a mixture. In order to avoid a change of solvent prior to the chromatographic analysis, only methanol is tested to elute the compounds from the extraction phase.
1) Find the different steps of the implementation of an extraction by SPE (diagram 1).


2) The conditions applied for the SPE are as follows:
- Sample solution deposited: 5 mL
- Wash with water: 2.5 mL
- Elution: 3 mL of MeOH
- Solution analyzed by HPLC adjusted to 10 mL with water
The concentrations of compounds A, B and C in the control solution are reported in Table 1.
Table 1. Concentrations of compounds A, B and C in the control solution.
| [A] | [B] | [C] | |
|---|---|---|---|
| Concentration (mg/L) | 51.2 | 51.6 | 49.4 |
Calculation example: [A] = 51.2 mg/L so in 5 mL mA = 5 x 51.2/1000 = 0.256 mg = 256 µg
3)The solution (10 mL) obtained after elution is analyzed by HPLC. The areas of the signals of A, B and C measured from the chromatogram are reported in Table 2.
Table 2. Areas of the signals of A, B and C measured on the chromatogram.
| A | B | C | |
|---|---|---|---|
| Signal areas | 635.71 | 368.03 | 296.20 |
a) According to the calibration curve, what are the concentrations of compounds A, B and C of the solution injected after SPE extraction?


b) What is the quantity of compounds of interest in the solution recovered after SPE and analyzed by HPLC?


c) What is the recovery efficiency R of the compounds A, B and C after SPE?


The log P (or log Kow) values of compounds A, B and C are reported in Table 3.
Table 3: log P values
Table 3: log P values
| log P (A) | log P (B) | log P (C) |
|---|---|---|
| 3.4 | 2.6 | 3.2 |
Assuming that the yield differences obtained for A, B and C are significant, what do you propose to optimize the yield of A and C?
Deposit less control solution because a part of the compounds A and C is not retained.
Decrease the volume of rinse water because a part of the compounds A and C is lost at this stage
Increase the elution (with MeOH) volume to elute all of A and C The slightly lower yields of A and C are most likely due to incomplete elution of these 2 compounds which have a greater affinity for the apolar solid phase than B. Log P (A) and log P (C)> Log P (B). (See the “To find out more”/“Physicochemical parameters” tab)


