


How to perform a calibration
Once the standard solutions have been analyzed, the calibration curve must be plotted, which will be a straight line if it is within the instrument’s linear range (and if the standard solutions have been prepared correctly). If a calibration point deviates from the straight line, it may be useful to remake the standard solution concerned.
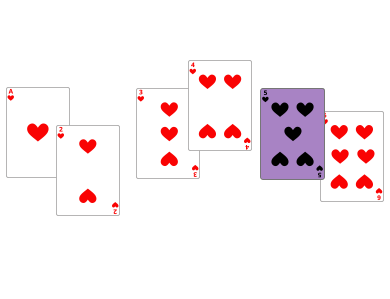
Interactive diagram : virtual plot of the calibration curve
based on the measurements of the standard solutions
based on the measurements of the standard solutions

Either concentrations or quantities can be used to plot the calibration line.