Assessing the calibration deviation
To have a quick idea of the quality of prediction of the calibration line, we can estimate the range deviation.
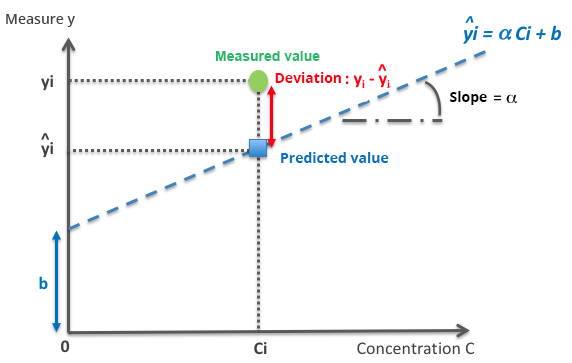
This is done by reverse calibration: for the standard solution Ci, the observed difference (or deviation) is calculated between the measured value (yi) and the predicted value (see figure). Each deviation is then estimated as a percentage, so as to compare the deviations, regardless of the concentrations of the standard solutions:
When the deviations remain less than 10% in absolute value, the calibration line makes it possible to adequately estimate the concentration of a sample if it is within the same concentration levels as the standard solutions under consideration. For deviations between 10 and 20%, the unknown concentration can be estimated with the calibration curve but with a lower quality of prediction. Lastly, when the observed deviations exceed 20%, the results obtained with the calibration curve are not reliable since the predicted values will be too far from the actual values.
The range deviation often varies with the concentration. The quality of prediction of the calibration line will therefore depend on the concentrations considered.